
Hormuz oscillation drags crude, gold, and grains — copper bucks the trend
The May 27 commodity morning briefing covers overnight moves across energy, precious metals, industrial metals, and agriculture — all framed by the US-Iran Strait of Hormuz standoff. WTI crude fell 3.5%+ on peace-talk optimism and resumed LNG tanker transits, grains dropped via the ethanol/biodiesel demand channel, and gold slid 1.4% as rate-hike expectations hardened. Copper stood apart near a historic monthly closing record. Thursday's April Core PCE release and the EIA inventory report are the next market-moving events.

May 27, 2026 morning briefing — US-Iran peace talks are grinding toward a deal but a fresh round of American airstrikes on May 26 keeps the outcome binary. That back-and-forth is the single thread pulling every commodity on Tuesday: crude fell more than 3.5% on ceasefire optimism, grains were dragged down through the ethanol and biodiesel channels, and gold sold off as the dollar stayed firm and rate-hike expectations hardened. Only copper printed close to a historic monthly record, driven by structural supply constraints that the Hormuz narrative hasn't changed. Thursday's April core PCE release is the next event that could shift the entire board.
Quick scan — May 26–27 moves at a glance
| Commodity | Price | Change | Key driver |
|---|---|---|---|
| WTI crude (CME Jul) | $90.57/bbl | −3.54% | Iran peace-talk optimism |
| Brent crude (EIA spot, May 22) | $106.90/bbl | +1.0% (May 22) | Still ~23% off $138 Apr 7 peak |
| WTI crude (May 27 early) | $90.25/bbl | −3.88% | LNG tankers resuming Hormuz transits |
| Brent crude (May 27 early) | $96.47/bbl | −3.12% | Same |
| Henry Hub gas (spot, May 22) | $2.92/MMBtu | −7.1% | Inventory glut (+6.6% above 5-yr avg) |
| Gold spot | $4,442/oz | −1.42% | Firm dollar; rate-hike repricing |
| Silver spot | $74.21/oz | −3.43% | Erased prior session gain |
| COMEX copper (HG00) | $6.40/lb | +0.06% | Near historic monthly closing record |
| Aluminum (MAL futures) | $3,669/t | −0.26% | Mild pullback |
| Iron ore 62% Fe (CME) | $109.26/t | flat | Near 52-week high $111.42 |
| Corn (CBOT Jul) | 457¼¢/bu | −1.24% | Crude selloff + fast planting pace |
| Wheat (CBOT SRW Jul) | 635½¢/bu | −1.63% | Fastest spring wheat planting in years |
| Soybeans (CBOT Jul) | $11.86/bu | −0.87% | Planting at 79%, above 68% avg |
| Sugar #11 (ICE Jul) | 14.39¢/lb | −1.03% | −15.7% year-on-year |
| DXY | 99.12 | −0.05% | Mild dollar softening |
| VIX | 16.85 | −0.94% | Second consecutive decline |
Macro backdrop: a ceasefire that isn't quite
The Strait of Hormuz has been effectively closed since late February, cutting roughly 10 million barrels per day of Middle Eastern crude — about 10% of global supply — from six countries: Iraq, Saudi Arabia, Kuwait, the UAE, Qatar, and Bahrain. 1
On May 26, Secretary of State Marco Rubio said a deal to stop the conflict could come "within days," with an initial framework covering a halt to hostilities and the resumption of Hormuz shipping, followed by a 60-day window to address Iran's nuclear program. Iran's stated final sticking point: unfreezing approximately $24 billion in assets. 1 Hours later, the US launched fresh airstrikes on missile sites and vessels in Iran's Hormozgan province. Iran called it a "flagrant violation" of the seven-week-old ceasefire. 1
That one-day whipsaw — peace-talk optimism in the morning, airstrikes by afternoon — is the direct cause of crude's 3%+ intraday reversal.
On the Fed side, the market has fully flipped its 2026 rate call. In March, traders were pricing 1–2 cuts; now they are pricing one hike. 2 CME FedWatch puts June unchanged at 99.1% probability but has September hiking to 3.75–4.00% at 22.5%. 3 Kevin Warsh is confirmed as the next Fed chair from the June 17 meeting. Dallas Fed President Lorie Logan, speaking in Japan, warned that a prolonged Hormuz closure could force the world to structurally reduce oil and gas consumption — the most direct Fed signal yet that the conflict is reshaping monetary policy assumptions. 4
The 30-year Treasury yield is above 5.0% — the highest since 2007 — and the 10-year sits near 4.5%. DXY is at 99.12, within striking distance of its 52-week high of 100.64. 5
Energy: crude reverses 3.5%+ as tankers start moving through Hormuz
WTI (CME July contract) is trading at $90.57/bbl on May 27, down $3.32 (−3.54%) from the prior settlement. Brent is at $96.47/bbl (−3.12%) early May 27, almost fully erasing the 3.6% gain from May 26 when the fresh airstrikes temporarily reignited supply risk. 6
The catalyst for the decline: PVM analyst Tamas Varga confirmed that some LNG tankers have already transited the chokepoint in recent days, signaling a trickle of resumed shipping.
"There has been palpable progress towards ending the crisis, and an increasing number of ships are transiting the critical chokepoint. This is why the downward pressure has resumed." — Tamas Varga, PVM 6
For context, Brent hit an intraday peak of $138/bbl on April 7 — the high-water mark for the current crisis — and has now pulled back about 30% from that level. The EIA's May Short-Term Energy Outlook forecasts Brent averaging $106/bbl for May–June, $95/bbl for 2026 as a whole, and $79/bbl in 2027 as flows normalize. 7 But EIA administrator Tristan Abbey noted a fundamental uncertainty:
"Just as we had never before seen the strait close, we've never seen it reopen. What exactly that looks like remains to be seen." 7

US crude inventories remain tight: the week ending May 15 saw commercial stocks fall 7.9 million barrels to 445 million barrels, about 2% below the five-year average. 8 Refinery utilization was 91.6%. The next inventory read — covering the week of May 22 — comes out Thursday, delayed one day from the Memorial Day holiday.
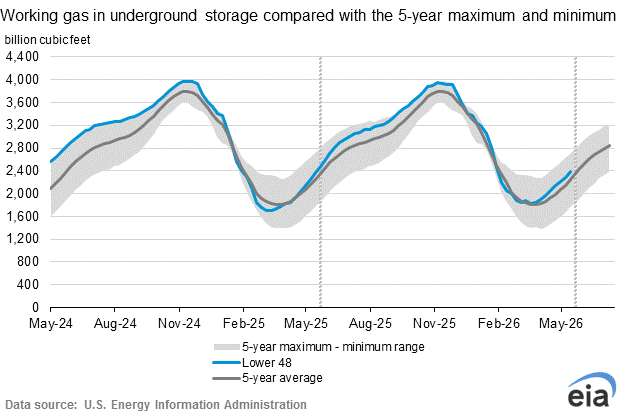
Natural gas is moving independently. The Henry Hub July futures contract trades at $3.04/MMBtu (+0.90% on May 27), 9 but the May 22 spot price was $2.92/MMBtu, down 7.1% on the day. Working gas in storage stood at 2,391 Bcf as of May 15 — 149 Bcf above the five-year average (+6.6%) — and US production in Q1 was running at 120.2 Bcf/day, up 4% year-on-year. 10 With LNG export capacity nearly full, the excess has nowhere to go, keeping gas prices structurally detached from the crude war premium.
Listed equities most affected:
- Crude upside plays (benefit from still-elevated oil): ExxonMobil (XOM), Chevron (CVX), ConocoPhillips (COP), Occidental Petroleum (OXY), EOG Resources (EOG)
- Refiners (squeezed by crude costs + weak crack spreads; the 3-2-1 crack spread was −9.3% on May 22): Marathon Petroleum (MPC), Valero (VLO), Phillips 66 (PSX)
- Natural gas plays (independent from crude): EQT Corp (EQT), Coterra Energy (CTRA), Cheniere Energy (LNG — for LNG exports running near full capacity)
Precious metals: gold reprices rates, not just war risk

Gold's relationship with the Hormuz conflict has shifted since early May. When the war broke out in late February, gold ran to near $5,500/oz on safe-haven demand. 11 Now the metal is sitting at $4,442 spot (−1.42%), roughly 15% off its highs, as the market reprices the scenario: a prolonged Hormuz closure that forces the Fed to hike, not cut. 2
The futures-spot divergence is worth watching. On May 26, the COMEX June contract settled at $4,502.30 (−$20.90) while spot gold fell $62.74 on the same day. 12 Gary Wagner of The Gold Forecast interprets this as futures markets quietly pricing out geopolitical risk premium while spot reacts to daily news flow:
"For several weeks running, spot gold has absorbed disproportionate selling pressure on days when futures have barely budged." 12
Silver had a more dramatic session: COMEX July settled up $0.407 at $76.606 on May 26, but spot silver is now at $74.21 (−3.43%) on May 27, erasing that gain. 13 Silver's industrial demand from solar panels and electronics provides a floor that pure monetary metals lack, which explains why it outperformed gold for part of the session.
Two structural factors are worth isolating from the daily noise:
Russia's central bank selling. Russia's gold reserves fell to 73.9 million oz (roughly 2,305 tonnes) as of May 1 — a 24-year low, with 27.9 tonnes sold in January–April 2026. 14 Analyst Natalia Milchakova of Freedom Finance Global said the sales are primarily to cover Russia's 4.6 trillion ruble budget deficit, with a secondary motive of building yuan reserves to replace weakening export revenue. 14
Stephen Innes of SPI Asset Management argues this is forced liquidity management, not an ideological shift away from gold:
"Forced selling is not ideological selling. It is an emergency reserve triage during an energy seizure." 15
Goldman Sachs raised its central bank gold buying estimate to 60 tonnes/month for 2026 (up from 29 t/month before the conflict and 50 t/month as of March), citing revised methodology for gaps in official trade data. 2 The Russia selling is real, but Goldman's reading is that aggregate central bank demand is still accelerating.
India's tariff headwind. India raised gold and silver import duties from 6% to 15% effective May 13. April gold imports dropped to 0.66 million oz — down 47% from the five-year monthly average of 1.25 million oz. 2
Gold ETF flows turned positive for the first time since early April — $824 million in North America and $180 million in Europe, per BMO. Silver ETF inflows hit 6.2 million oz, the highest since late February. 11 The flows suggest institutional buyers are starting to rebuild positions at lower prices, even as spot is pressured.
Key gold miners: Newmont (NEM), Barrick Gold (GOLD), Agnico Eagle (AEM — just approved a $2.4 billion Hope Bay project at 26% IRR assuming $4,500/oz gold, targeting 400–435k oz/year from 2030 11), Franco-Nevada (FNV), Wheaton Precious Metals (WPM). Silver: Pan American Silver (PAAS), First Majestic (AG).
Industrial metals: copper on track for its highest monthly close ever
Copper is the standout in today's session. The COMEX HG00 continuous contract trades at $6.40/lb (+0.06%) on May 27, following a May 26 settlement of $6.397/lb. 16 The month-to-date gain is roughly +8%, and Barchart flagged that copper is on track for its highest monthly closing price on record.
The copper story here is structurally distinct from the energy-driven selling. Managed Money net long positioning in COMEX copper remains heavily skewed — 87,457 long contracts vs. 13,269 short as of May 19 17 — reflecting conviction that supply constraints (mine permitting timelines, energy-intensive smelting costs, the energy transition's copper intensity) are more durable than the Hormuz risk premium. That structural tightness thesis is intact even as oil falls.
Aluminum (MAL futures) edged down to $3,669/t (−0.26%) on mild profit-taking after last week's gains. 18 Iron ore 62% Fe (CME TIOc1) is flat at $109.26/t, near its 52-week high of $111.42. 19 China's May PMI data — the key demand signal for iron ore — is due May 31 and is not yet available.
Key mining equities:
- Copper: Freeport-McMoRan (FCX), BHP Group (BHP), Southern Copper (SCCO), Glencore (GLEN)
- Iron ore: Rio Tinto (RIO), BHP (BHP), Vale (VALE)
- Aluminum: Alcoa (AA), Norsk Hydro (NHY)
Agriculture: crude selloff transmits through ethanol and biodiesel
The grain complex fell across the board on May 26 (Monday, markets were closed May 25 for Memorial Day). The common thread is the crude oil selloff: lower WTI directly reduces the economic incentive to blend corn ethanol and soybean-based biodiesel into the fuel supply, softening demand for both crops.
Corn (CBOT July) settled at 457¼¢/bu (−1.24%) on May 26. 20 US corn planting reached 86% as of May 24 — 3 percentage points ahead of the five-year average of 83%. Crop emergence is at 60% vs. a 58% historical average. 21 Fast planting progress reduces the weather-risk premium that often supports corn prices through spring.
Wheat (CBOT SRW July) settled at 635½¢/bu (−1.63%), the largest percentage loss among the major grains on the session. 22 Spring wheat planting stands at 89%, a full 10 points ahead of the five-year average of 79%. Winter wheat heading is at 78%, also above average. 23
Soybeans (CBOT July) settled at $11.86/bu (−0.87%). 24 Planting pace is 79% vs. a 68% five-year average — one of the fastest on record. Export inspections for the week of May 21 came in at 571,620 metric tons, double the year-earlier pace, providing partial support. 25 But strong exports are not enough to offset the crude-channel headwind and the supply-side pressure from unusually rapid field progress.
Sugar #11 (ICE July) is trading at 14.39¢/lb (−1.03%) on May 27. 26 The 52-week return is −15.7%, reflecting a structurally oversupplied global sugar market with favorable Brazilian cane conditions.
Agricultural equities: Archer Daniels Midland (ADM) is at $78.01 (+0.63%), with a $37.6 billion market cap, $80.3 billion in annual sales, and a Q2 EPS estimate of $1.29 (+38.7% year-on-year). 27 Bunge Global (BG) is at $120.10 (−0.51%), market cap $23.3 billion. 28 Both names benefit from high grain-processing throughput even when prices fall, since their margins depend more on volume and basis differentials than outright commodity price levels.
Equity and macro signals
The equity complex is telling a different story than most commodities. The S&P 500 closed at 7,519.12 (+0.61%) and the Nasdaq at 26,656.18 (+1.19%) on May 26, led by AI and semiconductor names. The VIX is at 16.85 (−0.94%), its second straight daily decline. 29 SK Hynix's market cap crossed $1 trillion for the first time.
The war is creating clear equity winners and losers. Energy producers and defense contractors benefit from sustained high oil prices; passenger airlines (S&P 500 airline index −6%+ since the war started) and consumer discretionary names are under pressure. 30
Coming up: the events that will move markets next
Thursday, May 28 (ET):
- 🌟 April Core PCE (8:30 AM) — the Fed's preferred inflation gauge. Market consensus is 3.2% year-on-year, matching March. Core PCE has held in the 3.0–3.2% range for five straight months, well above the Fed's 2% target. 31 A print at 3.3% or above would materially reinforce the September hike scenario (currently priced at 22.5%) and is the clearest near-term risk for gold and rate-sensitive assets.
- 🌟 EIA Weekly Petroleum Status Report (12:00 and 2:00 PM) — delayed one day from Memorial Day. The prior report (May 15 week) showed a 7.9-million-barrel draw. A second large draw would signal that demand remains resilient despite four-dollar-plus gasoline. 32
- USDA Agricultural Trade Outlook for May 2026 (2:00 PM) — will include updated export forecasts for corn, wheat, soybeans, and cotton; relevant for positioning in the grain complex.
Saturday, May 31: China's official PMI for May — the most direct near-term read on Chinese industrial demand, which drives iron ore and copper.
The Hormuz situation remains the master variable. A confirmed ceasefire agreement could send Brent back toward the $80s within days; a breakdown in talks — especially if Iran responds militarily to the May 26 strikes — could push it back toward $110+. Every commodity on this board follows that binary.
Cover: AI-generated illustration.
参考ソース
- 1Reuters — Iran says new US strikes violate ceasefire
- 2Kitco News / Ernest Hoffman — Gold and silver prices under pressure from rising inflation and rate expectations
- 3Investing.com — Fed Rate Monitor Tool
- 4Reuters — Fed's Logan: world may need to cut use of oil and natural gas
- 5MarketWatch — U.S. Dollar Index (DXY) Overview
- 6Reuters — Oil prices drop as traders look for US-Iran talks progress
- 7EIA — EIA updates forecast amid continued Mideast disruption
- 8EIA — Weekly Petroleum Status Report Highlights (week ending May 15)
- 9CME Group — Henry Hub Natural Gas Futures Overview
- 10EIA — Weekly Natural Gas Storage Report (week ending May 15)
- 11Kitco / Frank Holmes — Gold SWOT
- 12Kitco Commentaries / Gary Wagner & Joseph Wagner — Gold Futures Hold Firm as Spot Prices Take a Harder Hit
- 13Kitco Metals — Precious Metals Spot Prices
- 14Kitco News / Ernest Hoffman — Russia's sovereign gold reserves plunge 5.7 tonnes in April to 24-year low
- 15Kitco News / Ernest Hoffman — Gold's forced sovereign liquidations could pave the way for the metal's next great bull run
- 16MarketWatch — HG00
- 17Barchart — High Grade Copper Jul '26 Futures
- 18Investing.com — Aluminium Price Today
- 19Investing.com — Iron ore fines 62% Fe CFR Futures
- 20CME Group — Corn Futures Settlements
- 21Barchart — Corn Jul '26 Futures
- 22CME Group — Chicago SRW Wheat Futures Settlements
- 23Barchart — Wheat Jul '26 Futures
- 24CME Group — Soybean Futures Settlements
- 25Barchart — Soybean Jul '26 Futures
- 26Barchart — Sugar #11 Jul '26 Futures
- 27Barchart — ADM Stock Overview
- 28Barchart — BG Stock Overview
- 29Investing.com — VIX Index
- 30Reuters — Iran war splits global markets into clear winners and losers
- 31Investing.com — United States Core PCE Price Index YoY
- 32EIA — Weekly Petroleum Status Report
このコンテンツについて、さらに観点や背景を補足しましょう。